
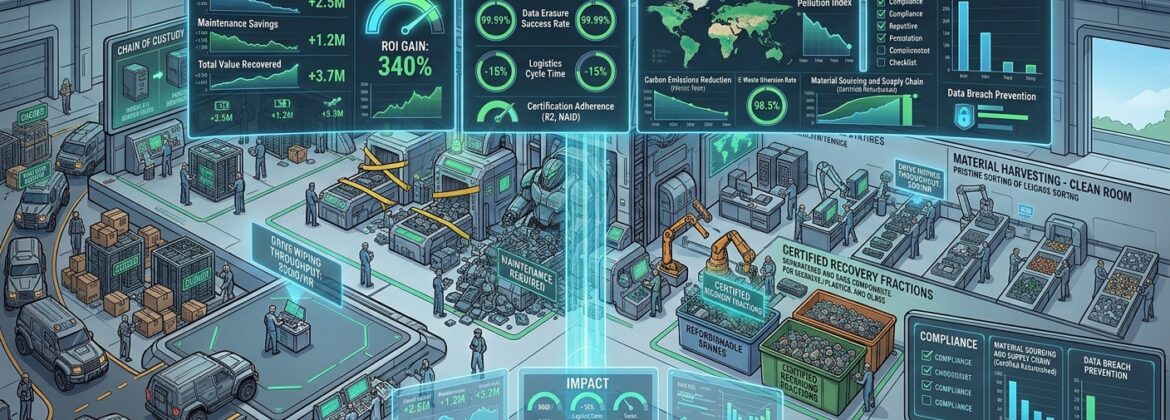
Quantifying ITAD Impact: Metrics That Matter for Business & Environment
Category: Analytics & Business Intelligence | Read Time: 10 minutes
Executive Summary
You can’t manage what you don’t measure. Yet most enterprises lack visibility into ITAD metrics and impact. Here’s how to build a measurement framework that demonstrates business value and environmental impact.
The ITAD Metrics Framework
Strategic ITAD management—practiced by certified providers like CSC—requires tracking metrics across multiple dimensions:
Financial: Cost avoidance, revenue realization, risk mitigation value
Environmental: Carbon impact, material recovery, waste diversion
Compliance: Documentation completeness, audit readiness, regulatory exposures
Operational: Asset processing timelines, data destruction certification, vendor performance
Strategic: ESG reporting impact, investor confidence, competitive positioning
A comprehensive dashboard tracks these metrics for management visibility.
Financial Metrics
Start with what finance understands: dollars saved and generated.
Annual ITAD Financial Impact for a 500-person enterprise:
Device refurbishment revenue: $20,000-40,000
Material recovery commodity revenue: $8,000-15,000
Landfill disposal cost avoidance: $6,000-12,000
Tax incentives and donations: $3,000-8,000
Risk mitigation value (avoiding data breach): $4,000,000-12,000,000
Compliance penalty avoidance: $500,000-2,000,000
Total quantifiable value: $4,537,000-14,075,000
The risk mitigation value is often 100-200x the direct revenue generation. This is how you justify ITAD investment to the CFO.
Environmental Metrics
Environmental impact resonates with ESG investors and conscious consumers. Key metrics:
CO₂ avoided through proper recycling vs. landfill: Measured in metric tons
Material recovery rate: Percentage of equipment weight recovered as materials
Refurbishment rate: Percentage of equipment extending to second use
Avoided resource extraction: Equivalent virgin material displaced by recovery
Water savings: From reducing manufacturing demand through reuse
Hazardous waste diverted: Pounds of e-waste kept out of landfills
Example: A single server lifecycle managed through R2v3 recycling avoids approximately 0.79 metric tons of CO₂. With 500 devices annually, that’s 395 metric tons of CO₂ avoided—equivalent to removing ~86 cars from the road for a year.
Operational Metrics
Track operational excellence:
Data destruction certification rate: 100% of devices documented
Chain of custody completion: No devices unaccounted for
Average processing time: From collection to final disposition
Vendor audit results: Compliance and performance verification
Asset recovery rate: Percentage of devices with salvage value
Incident rate: Data breaches, environmental violations, compliance issues (target: zero)
These metrics demonstrate operational discipline to auditors and regulators.
Compliance & Risk Metrics
For compliance-focused stakeholders:
Regulatory exposure: Estimated penalty avoidance from compliance
Audit readiness: Documentation completeness percentage
Vendor certification status: Percentage of ITAD partners R2v3-certified
ESG disclosure completeness: ITAD data included in sustainability reporting
Insurance coverage: Reduction in e&o premiums from certified ITAD practices
These metrics link ITAD to business risk management.
Building Your Dashboard
Leading enterprises establish quarterly ITAD scoreboards for board/audit committee review:
Financial impact summary (YTD and annual projections)
Environmental metrics and ESG impact
Compliance status and audit readiness
Vendor performance and certification status
Risk metrics and incident tracking
Strategic positioning and investor communication readiness
This transforms ITAD from an invisible operational function into a strategic asset.

Leave a Comment